A directional coupler is a device used in radio frequency (RF) circuits and measurement devices. Its effect is quite simple: you can picture an (ideal, 3-port, 20dB) directional coupler as a little grey box with three plugs labeled "IN", "OUT", and "COUPLED". If you feed a RF signal (imagine a 200MHz sine wave) into the IN port, then 99% of that signal will be available at OUT, and 1% be coupled to the COUPLED port. If you switch the OUT and IN ports, i.e. feed the RF signal into the OUT port, then 100% will be available at IN, and nothing will reach the COUPLED port. So, basically, on the COUPLED port, you get 1% of what flows from IN to OUT, ignoring signals going the other way round.
 |
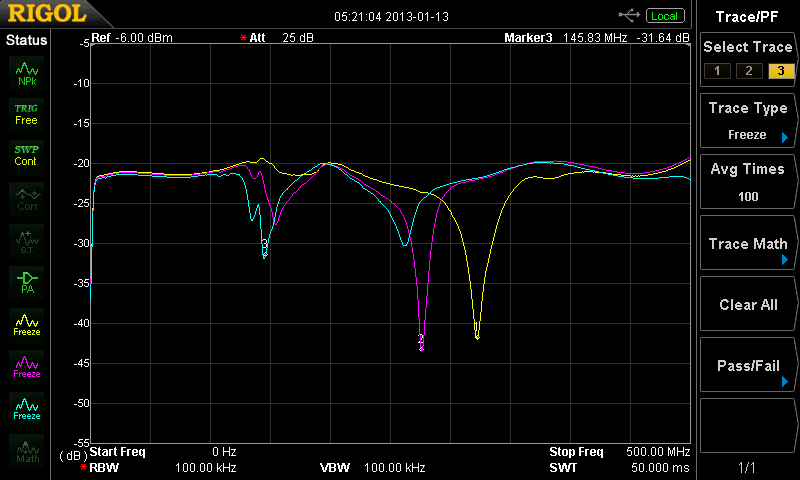
| Insertion loss of three pieces of wire, indicating their resonant frequencies, measured with a spectrum analyzer and a directional coupler. |
Keep in mind that, for electromagnetic waves, it's not at all a problem to have two waves in the same cable spreading in two different directions. And this is exactly where the coupler comes into play: If there's two signals in a cable spreading in opposite directions, it allows you to measure only one or the other (a 4-port coupler would allow to measure both seperately and simultaneously).
This sounds cool, so I bought one at ebay (24 Euros). So, let's see if it works and what can be done with it!
Easiest case first: The signal goes into the IN port, and we look at the signal coming out of the OUT port.
 |
| A signal going from IN to OUT can pass through the coupler (almost) without anything happening to it. |
|
I guess the above and the following plots need a bit of explanation on how they were obtained and how to read them. The images are screenshots from a spectrum analyzer. The x axis (horizontal) denotes frequency, and the y axis denotes the measured power at that frequency. While measuring power at a specific frequency, the spectrum analyzer generates a reference output signal (a sine wave) at the very same frequency. This frequency rapidly sweeps through the whole x range of the diagram. The device generating the reference signal is called a tracking generator (TG). It's called "tracking" because its output frequency tracks the frequency the spectrum analyzer currently detects power at. This TG output is used as a signal source in the following measurements.
The y axis (vertical) denotes how much of the power from the TG was left after the signal passed whatever is between the output and the input port of the analyzer (in this case, because we're using the TG, but the signal could also have a different source). If you just connect output and input port with a cable, you get a straight line at "0", meaning "no power was lost". The scale is logarithmic, so "-10dB" means "90% of the power was lost", and "-20dB" means "99% of the power was lost". Positive values usually don't occur for passive devices.
So, to summarize this again: Each x-y-point on the curve tells you how much power was lost on the signal's way though the network (y),
at one very specific signal frequency (x).
Now, back to topic! In the above diagram, it's easy to see what happens: close to nothing. The signal just passes from IN to OUT through the coupler, as it should be.
You get about the same result if you make the signal go from OUT to IN, 1% going to the COUPLED port isn't really that much.
Next, let's send the signal into the IN port and measure what we get at COUPLED:
 |
| Signal input at the IN port, OUT open, measuring the power at COUPLED. |
For a 20dB coupler, this seems about right: For all frequencies, we get a roughly constant result, which is a signal level of -20dB. This means that 1% (= -20dB) of the power which we put into the IN port goes to COUPLED.
If we send the signal into the OUT port and measure at COUPLED, one could intuitively expect that nothing reaches the COUPLED port, right? But this is not the case:
 |
| Signal input at the OUT port, IN open, measuring the power at COUPLED. |
As you can see, you get about the same result as above. Why is that? Well, the IN port is open, which means that all power will be reflected there (where else should it go). The signal goes from OUT to IN, then there's nowhere to go to, so it just goes back, and from the part going back, we get 1% coupled into the COUPLED port (since that part going from IN to OUT). You can see that the signal level roughly 1dB less than in the IN -> OUT case, which is probably because a small part of the signal is not reflected at IN, but instead dissipates somewhere or radiates away.
We can now connect a 50 Ohm terminator to the IN port. Then we get what you maybe had expected previously:
 |
| Signal input at the OUT port, IN terminated (badly) by a 50 Ohm load, measuring the power at COUPLED. |
Note that the signal level dropped to less than -40dB for most frequencies, which means that more than 99% of the power are absorbed by the 50 Ohm load at the IN port (-40dB = -20dB from the coupler plus about -20dB from the load). Also note that the load is very bad (a SMD resistor taped to the plug) and with a better load you'd probably get a much lower signal level (up to the Directivity of the coupler, which would calculate to something like -57dB for this one here). In fact this whole thing is quite taped, because I'm still waiting for the adaptors I ordered to arrive.
This measurement technique now makes it possible to check how well a device is matched to 50 Ohms, something which is very important when building RF stuff. For example, you can check the matching of a dipole antenna ("piece of wire"):
 |
| Signal input at the OUT port, IN attached to a piece of wire, measuring the power at COUPLED. |
The wire reflects most of the power at most frequencies, except for frequencies close to 313.3 MHz. For 313.3 MHz, the wavelength in free space is 95.75 cm, thus a quarter wavelength is 23.9 cm. Coincidentially, the piece of wire happens to be 23.6 cm long. So, this peak tells you where the "antenna" is matched to free space, and radiates the energy you send into it away instead of reflecting it back. It also tells us that physics works, yay! This kind of measurement will (probably) prove to be very useful when building the antennas for my radio interferometer soon.


No comments:
Post a Comment
Note: Only a member of this blog may post a comment.